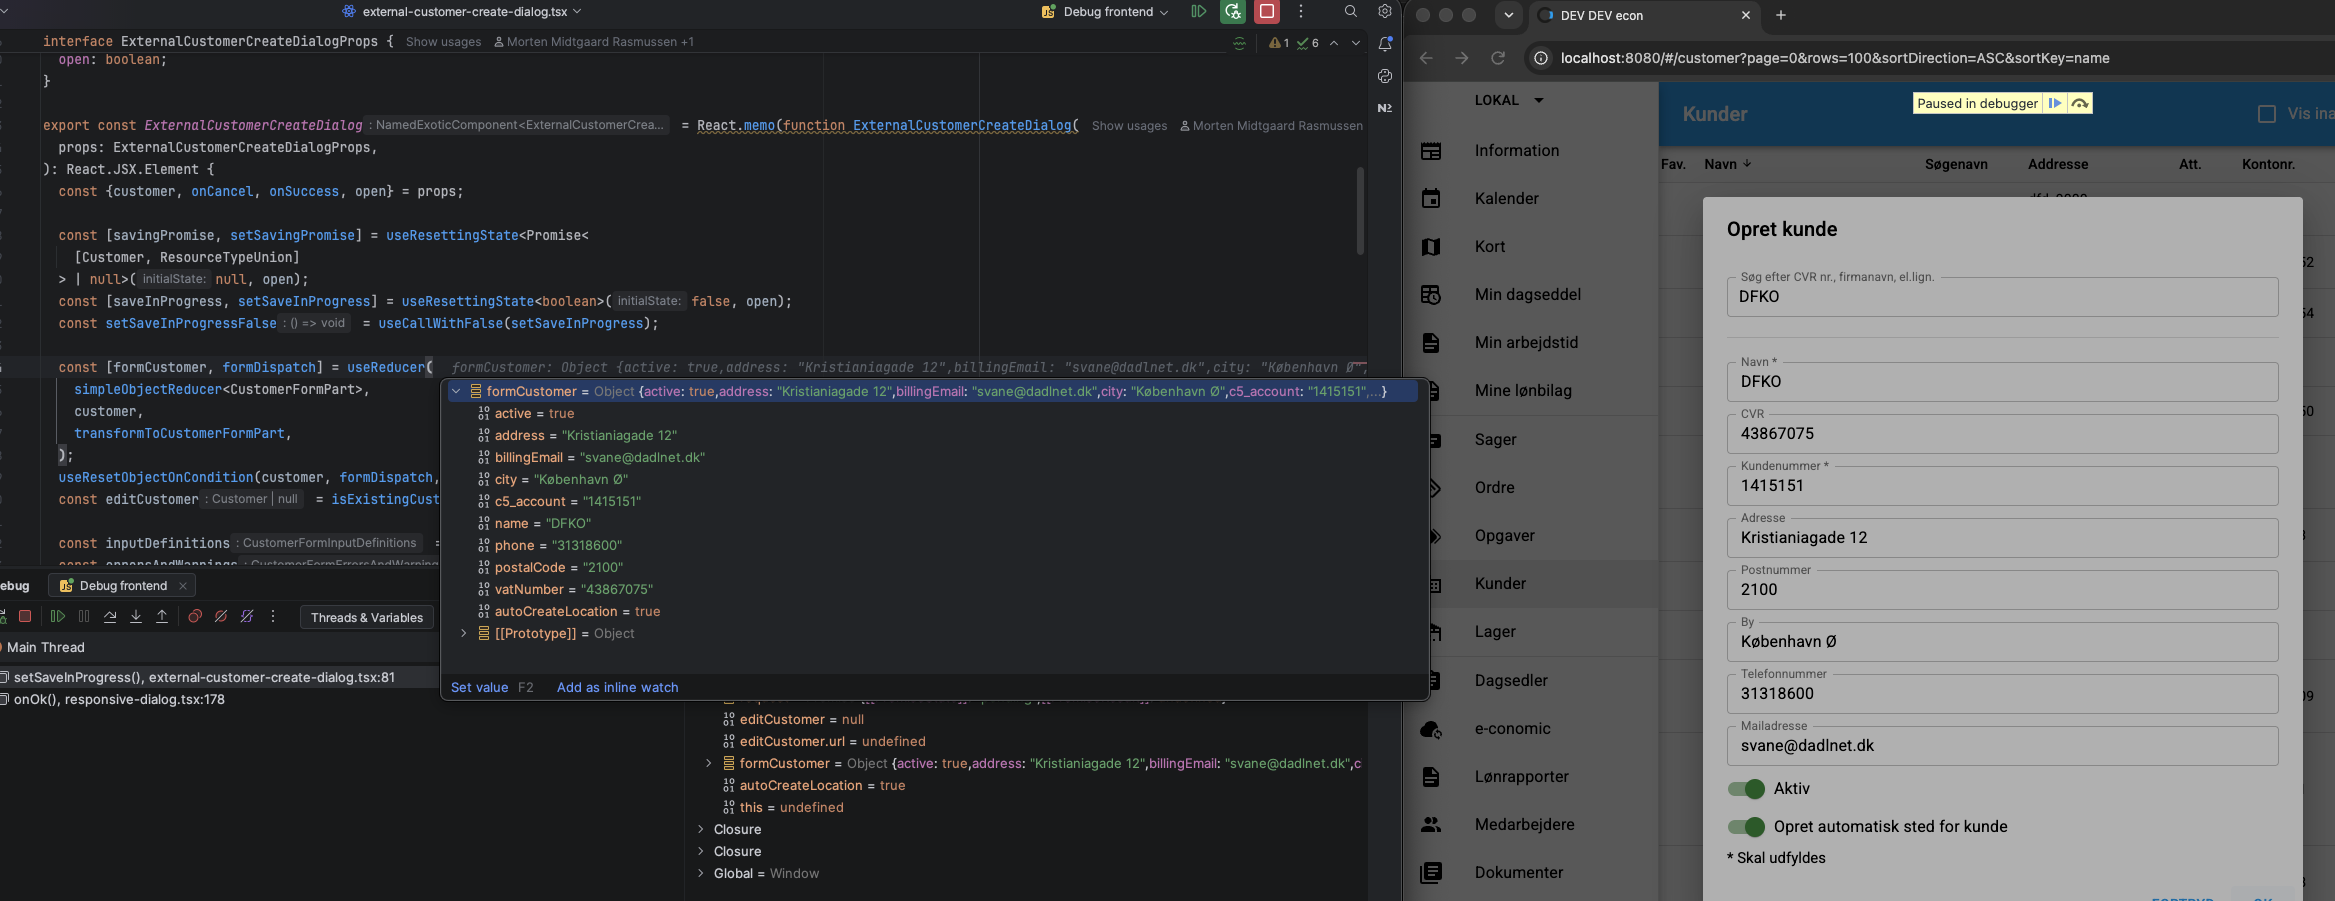
Attach debugger to frontend
Sometimes you wish to know exactly what state the code is in when a callback or effect is triggered.
One way of getting such information is to write to the console. This is however both tedious and in some cases error prone. Here are some of the arguments against console logs:
- The "Live Reference" Illusion: Expanding an object in the console reveals its current mutated state rather than a historical snapshot, whereas a debugger perfectly freezes time.
- Context Blindness: A log only shows a variable's value, but a debugger provides the full Call Stack to show exactly how you arrived there.
- The React State Trap: React's asynchronous state updates often cause logs to output confusing, stale variables that misrepresent what is actually happening.
- The Iteration Tax: Debuggers let you inspect code on the fly, eliminating the frustrating save-recompile-reload cycle that destroys your UI state.
- Code Pollution: Relying on logs litters your codebase, degrades browser performance, and risks leaking sensitive data into production.
Webstorm
Bring up the command palette ( Cmd+Shift+A on MacOS) and open "Edit configurations..."
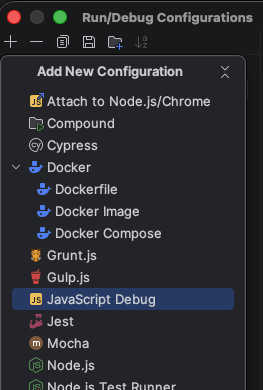
Here you add a new "JavaScript Debug" configuration:
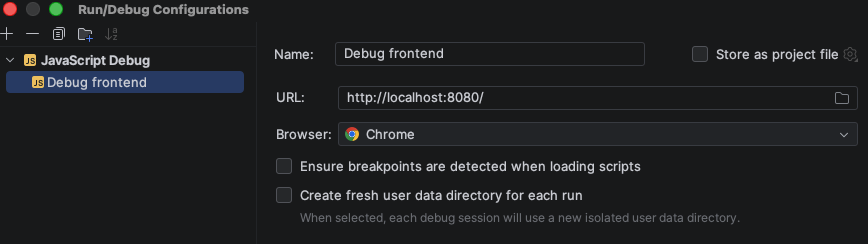
Type in the URL of our local development frontend http://localhost:8080/ and select the browser of your choice.
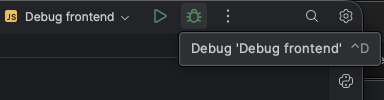
With this configuration saved, you can now start local development as normal. Once everything is up and running, you can attach the debugger to the browser.
Thats it! You can now add a breakpoint in Webstorm and inspect the state with full debug context.